Help needed with graphing exponential functions
Hi
In the question I have been wondering how to do which is on a calculus paper, first it shows this table of values:
x 0 0.5 1 1.5 2 2.5 3
y=3e^2x 3 8.15 22.17 60.26 163.79 445.24 1210.27
Then the question asks to draw the above graph, however I do not know where to start.
Do I need to differentiate the y=3e^2x?
Or do I plot it as it is?
Thanks
Original post by dc2209
Hi
In the question I have been wondering how to do which is on a calculus paper, first it shows this table of values:
x 0 0.5 1 1.5 2 2.5 3
y=3e^2x 3 8.15 22.17 60.26 163.79 445.24 1210.27
Then the question asks to draw the above graph, however I do not know where to start.
Do I need to differentiate the y=3e^2x?
Or do I plot it as it is?
Thanks
In the question I have been wondering how to do which is on a calculus paper, first it shows this table of values:
x 0 0.5 1 1.5 2 2.5 3
y=3e^2x 3 8.15 22.17 60.26 163.79 445.24 1210.27
Then the question asks to draw the above graph, however I do not know where to start.
Do I need to differentiate the y=3e^2x?
Or do I plot it as it is?
Thanks
Just plot it - you have the values!
There are no subtleties with the exponential function - no maxima or minima - and you should know the general shape of the curve. The only thing to mark is the y-intercept value.
Original post by davros
Just plot it - you have the values!
There are no subtleties with the exponential function - no maxima or minima - and you should know the general shape of the curve. The only thing to mark is the y-intercept value.
There are no subtleties with the exponential function - no maxima or minima - and you should know the general shape of the curve. The only thing to mark is the y-intercept value.
Ah thank you it seems I was over complicating it.
What do you mean mark the y=intercept value? I thought the y axis needed to follow the structure of y=mx+c and C is the intercept? I'm a bit confused
Thanks anyway
Original post by davros
Just plot it - you have the values!
There are no subtleties with the exponential function - no maxima or minima - and you should know the general shape of the curve. The only thing to mark is the y-intercept value.
There are no subtleties with the exponential function - no maxima or minima - and you should know the general shape of the curve. The only thing to mark is the y-intercept value.
Also, when I enter the question in wolfram alpha, I get this http://gyazo.com/dfef4ded2cf3f1b963be38ffae4e1b8e
however as you can see the question provides values on the y axis which go up to 1210.27?
Original post by dc2209
Ah thank you it seems I was over complicating it.
What do you mean mark the y=intercept value? I thought the y axis needed to follow the structure of y=mx+c and C is the intercept? I'm a bit confused
Thanks anyway
What do you mean mark the y=intercept value? I thought the y axis needed to follow the structure of y=mx+c and C is the intercept? I'm a bit confused
Thanks anyway
The y-intercept is just where the graph crosses the y-axis i.e. the value when x = 0.
Original post by dc2209
Also, when I enter the question in wolfram alpha, I get this http://gyazo.com/dfef4ded2cf3f1b963be38ffae4e1b8e
however as you can see the question provides values on the y axis which go up to 1210.27?
however as you can see the question provides values on the y axis which go up to 1210.27?
If you look at what it's plotted, it thinks you've entered not so it's given you a straight line! I don't know wolfram alpha but I suspect you need to enter some brackets around the 2x.
Original post by davros
The y-intercept is just where the graph crosses the y-axis i.e. the value when x = 0.
If you look at what it's plotted, it thinks you've entered not so it's given you a straight line! I don't know wolfram alpha but I suspect you need to enter some brackets around the 2x.
If you look at what it's plotted, it thinks you've entered not so it's given you a straight line! I don't know wolfram alpha but I suspect you need to enter some brackets around the 2x.
Ah I see thank you it is figured out now and I have drawn the graph.
Btw if I wanted find the gradient when x = 2 from the graph would that be as simple as drawing a line from x = 2 to the curve and then reading the value on the y axis?
Thanks
Original post by dc2209
...
No. That is while the gradient is which requires differentiation.

Original post by lazy_fish
No. That is while the gradient is which requires differentiation.
so it isnt right?
this is the graph i have drawn
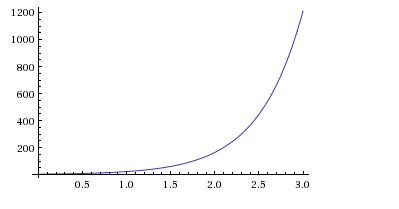
It should follow this general shape...except with differing values (as the equation is different)
Quick Reply
Related discussions
- In v=ab^t. What does b represent. Logb is the gradient I think but what is b. Thanks
- Lse Economics and Economic history…help please
- AS logs help
- Bristol Maths Test for Engineering Courses
- Temperature cooling function
- Can someone help me with what this means?
- Oxbridge Maths - Interview Questions
- Intergrate
- GCSE Mathematics Study Group 2023-2024
- Stuck on exponential modelling question where the initial value isnt given
- Knowing which particular integral to use for ordinary differential equations
- maths question help
- Quick trig question
- maths limits
- Edexcel alevel maths question
- Isaac physics A Square Pulse C3 - PLEASE help
- KS plot
- How to describe these 2 different types of graphs? (A-level)
- My grow your grades journal 🎀 ~ as a year 12
- Topics that came up in the A2 Edexcel Maths Paper 1 2023?
Latest
Last reply 3 minutes ago
Medical doctor degree apprenticeship 2024Last reply 3 minutes ago
NICS Staff Officer and Deputy Principal recruitment 2022 2023Last reply 8 minutes ago
What happens if i dont manage to find housing for second yr?- Uni of BathLast reply 8 minutes ago
Best university to study media and communications ?Last reply 9 minutes ago
Speech and language therapy MMU undergradTrending
Last reply 1 day ago
Did Cambridge maths students find maths and further maths a level very easy?Last reply 2 weeks ago
Edexcel A Level Mathematics Paper 2 unofficial mark scheme correct me if wrongMaths
71
Trending
Last reply 1 day ago
Did Cambridge maths students find maths and further maths a level very easy?Last reply 2 weeks ago
Edexcel A Level Mathematics Paper 2 unofficial mark scheme correct me if wrongMaths
71


