Increasing and decreasing intervals
Lets say I have a cubic equation and I need to work out the intervals in which the function is increasing or decreasing, how do I do this?
I know you have to differentiate it, then it is increasing when the differential is greater than 0 and decreasing when its less than. What I want to know is that is there an algebraic way of finding this out, and how do you find out "both intervals".
Like with my equation, I differentiated and let it equal 0. I now have 2 numbers where dy/dx is 0, but I'm stuck.
What do I do?
Thank you
What SimonM said.
If you find the stationary points of your cubic (where gradient is zero), you know the boundary of each interval. Then determine if these points are maxima or minima: if it's a maximum point of the graph, to the left of the stationary point will be rising, the right falling. Opposite holds true for a minimum.
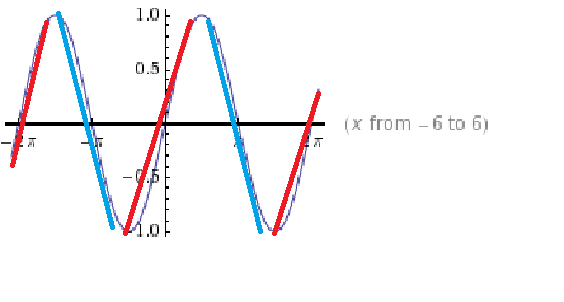
This is very easily seen on a sine wave between 0 and 2pi, if you want a visual example:
Red lines indicate rising intervals;
Blue lines indicate falling intervals
Or, more helpfully, a random cubic function:
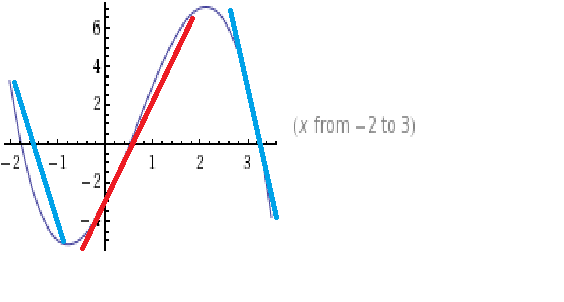
...Thanks to WolframAlpha for the quick graph plots.
If you find the stationary points of your cubic (where gradient is zero), you know the boundary of each interval. Then determine if these points are maxima or minima: if it's a maximum point of the graph, to the left of the stationary point will be rising, the right falling. Opposite holds true for a minimum.
This is very easily seen on a sine wave between 0 and 2pi, if you want a visual example:
Red lines indicate rising intervals;
Blue lines indicate falling intervals
Or, more helpfully, a random cubic function:
...Thanks to WolframAlpha for the quick graph plots.
Original post by SimonM
So you ended up with three intervals. Less than both roots, in-between the roots, larger than both roots. Work out a value in each range and you're done.
(Or look at the coefficient of x^3, this should give you the general shape and you should be able to work it out)
(Or look at the coefficient of x^3, this should give you the general shape and you should be able to work it out)
What do you mean "work out a value in each range"? Lets say that when dy/dx = 0, my x values are a and b, where a < 0 < b.
What do I do from here? Do I have to second differentiate and find the maximum and minimum points - showing me where it is increasing or decreasing?
Btw, my graph, I made a bit of a mistake, its not a cubic but its a fraction with a quadratic at the top and a linear at the bottom. Does this change anything?
Also, what are "zeros"?
The question says "locate any zeros, asymptotes, extrema and points of inflection..." and I probably know what it is, just not in the correct terminology.
Thanks
The question says "locate any zeros, asymptotes, extrema and points of inflection..." and I probably know what it is, just not in the correct terminology.
Thanks
Original post by claret_n_blue
Also, what are "zeros"?
The question says "locate any zeros, asymptotes, extrema and points of inflection..." and I probably know what it is, just not in the correct terminology.
Thanks
The question says "locate any zeros, asymptotes, extrema and points of inflection..." and I probably know what it is, just not in the correct terminology.
Thanks
Zeros are the roots.
Btw, my graph, I made a bit of a mistake, its not a cubic but its a fraction with a quadratic at the top and a linear at the bottom. Does this change anything?
The shape of your graph will be different, the principles the same. Find the turning point, detemine the nature of it and you'll know which intervals are rising and falling.
(edited 13 years ago)
Original post by claret_n_blue
What do you mean "work out a value in each range"? Lets say that when dy/dx = 0, my x values are a and b, where a < 0 < b.
What do I do from here? Do I have to second differentiate and find the maximum and minimum points - showing me where it is increasing or decreasing?
Btw, my graph, I made a bit of a mistake, its not a cubic but its a fraction with a quadratic at the top and a linear at the bottom. Does this change anything?
With those x values (a < 0 < b) a value smaller than both could be: a-1. (Basically anything in the range x < a). A value between a and b could be 0. (Anything in the range a< x < b). A value larger than both roots could be b+1 (anything in the range x > b).
Once you've found these values, you can see whether or not the gradient is positive or negative in that range. (If since it can't change sign without going through zero*)
Yes, it will change something. (You need to be careful when the bottom is zero, since the gradient could change sign without going through zero*)
Original post by SimonM
With those x values (a < 0 < b) a value smaller than both could be: a-1. (Basically anything in the range x < a). A value between a and b could be 0. (Anything in the range a< x < b). A value larger than both roots could be b+1 (anything in the range x > b).
Once you've found these values, you can see whether or not the gradient is positive or negative in that range. (If since it can't change sign without going through zero*)
Yes, it will change something. (You need to be careful when the bottom is zero, since the gradient could change sign without going through zero*)
Cool thanks, 1 more question:
1) What does the '*' on zero* mean?
(edited 13 years ago)
Original post by claret_n_blue
Cool thanks, 1 more question:
1) What does the '*' on zero* mean?
1) What does the '*' on zero* mean?
I meant look at the bottom bit, it's not always true.
Original post by SimonM
I meant look at the bottom bit, it's not always true.
Oh ok, yeah I get that. I didn't know they were linked lol sorry.
One final question, lets say a-1 gives me a negative gradient, does that mean I say that f(x) is decreasing on the open interval (a-1, a) or (-infinity , a)?
Quick Reply
Related discussions
- Edexcel Maths AS Pure June 2023 Q1(b)
- finding intervals differentiation question?
- Convergence of Fourier series
- Physics question displacement
- Why does potential difference increase when resistance increases?
- le chapeliers principle, exo and endo?????
- GCSE physics question circuits
- GCSE Chemistry Triple Science
- A-level Biology - Heart rate control
- What types of questions can appear with percentage calculations?
- As temperature increases, what the hell happens to current and resistance??
- Numerical Methods Question
- Chemistry - melting point
- Maths percentages
- Increasing and decreasing functions AS level pure math differentiation
- moments physics a alevel
- Help! Electricity igcse physics qs make no sense
- A level physics electricity question (7)
- equilibriums in reversible reactions
- Chem a level: Maxwell -Boltzman Distribution Curve, why does height of peak decrease?
Latest
Trending
Last reply 2 days ago
Did Cambridge maths students find maths and further maths a level very easy?Last reply 2 weeks ago
Edexcel A Level Mathematics Paper 2 unofficial mark scheme correct me if wrongMaths
71
Trending
Last reply 2 days ago
Did Cambridge maths students find maths and further maths a level very easy?Last reply 2 weeks ago
Edexcel A Level Mathematics Paper 2 unofficial mark scheme correct me if wrongMaths
71