PMCC Hypothesis Testing - Question 8b (help)
Scroll to see replies
Original post by HS_1
no worries! Also if u need help w applied maths check out: mathsgenie & Haberdashers' Adams Maths Dept (both are yt channels and are kinda more tailored towards Edexcel spec if ure doing tht? if not, it's still worth checking out.)
Ahh, I do the AQA specification! But will be sure to check it out. Thank you!
I have another quick question, part 8c of the same question, just looked at it 😂
I’d assume the “correlation coefficient” and the “p-value” are the exact same thing right? So I’d say that the p-value increases. And it asks for a reason— would I put “The p-value increases since the variables are becoming more correlated”?
Original post by TheoP31
Ahh, I do the AQA specification! But will be sure to check it out. Thank you!
I have another quick question, part 8c of the same question, just looked at it 😂
I’d assume the “correlation coefficient” and the “p-value” are the exact same thing right? So I’d say that the p-value increases. And it asks for a reason— would I put “The p-value increases since the variables are becoming more correlated”?
No. The p value includes the number of data. It is not the strength of correlation, but the reliability with which it can be estimated.
However, if the mean (correlation coefficient) moves further from 0, the whole distribution is shifted away from 0 so the p value decreases.
(edited 3 years ago)
Original post by TheoP31
Ahh, I do the AQA specification! But will be sure to check it out. Thank you!
I have another quick question, part 8c of the same question, just looked at it 😂
I’d assume the “correlation coefficient” and the “p-value” are the exact same thing right? So I’d say that the p-value increases. And it asks for a reason— would I put “The p-value increases since the variables are becoming more correlated”?
I have another quick question, part 8c of the same question, just looked at it 😂
I’d assume the “correlation coefficient” and the “p-value” are the exact same thing right? So I’d say that the p-value increases. And it asks for a reason— would I put “The p-value increases since the variables are becoming more correlated”?
no, they're not the same thing. The correlation coefficient is a measure of the linear relationship whereas the p value is used to see if the result is significant or not i.e. do we reject the null hypothesis and therefore it couldn't have happened by chance or accept it and so the probability of getting tht observed result or something more extreme is very small? If the r value (pmcc value) gets bigger then there is a more positive correlation between ''x'' and ''y''.
Original post by mqb2766
No. The p value includes the number of data. It is not the strength of correlation, but the reliability with which it can be estimated.
However, if the mean (correlation coefficient) moves further from 0, the whole distribution is shifted away from 0 so the p value decreases.
However, if the mean (correlation coefficient) moves further from 0, the whole distribution is shifted away from 0 so the p value decreases.
Original post by HS_1
no, they're not the same thing. The correlation coefficient is a measure of the linear relationship whereas the p value is used to see if the result is significant or not i.e. do we reject the null hypothesis and therefore it couldn't have happened by chance or accept it and so the probability of getting tht observed result or something more extreme is very small? If the r value (pmcc value) gets bigger then there is a more positive correlation between ''x'' and ''y''.
Ah right, okay. Thank you both! It makes some sense to me.
Sorry btw, my teacher didn't even teach us this - I've checked the AQA specification, it only wants us to be able to do simple hypothesis tests with all of this PMCC stuff. This is what our spec says: (not sure why we have questions based on this "reasoning" sorta stuff)
You two have helped a lot! Thank you.
Original post by TheoP31
Ah right, okay. Thank you both! It makes some sense to me.
Sorry btw, my teacher didn't even teach us this - I've checked the AQA specification, it only wants us to be able to do simple hypothesis tests with all of this PMCC stuff. This is what our spec says: (not sure why we have questions based on this "reasoning" sorta stuff)

You two have helped a lot! Thank you.
Sorry btw, my teacher didn't even teach us this - I've checked the AQA specification, it only wants us to be able to do simple hypothesis tests with all of this PMCC stuff. This is what our spec says: (not sure why we have questions based on this "reasoning" sorta stuff)
You two have helped a lot! Thank you.
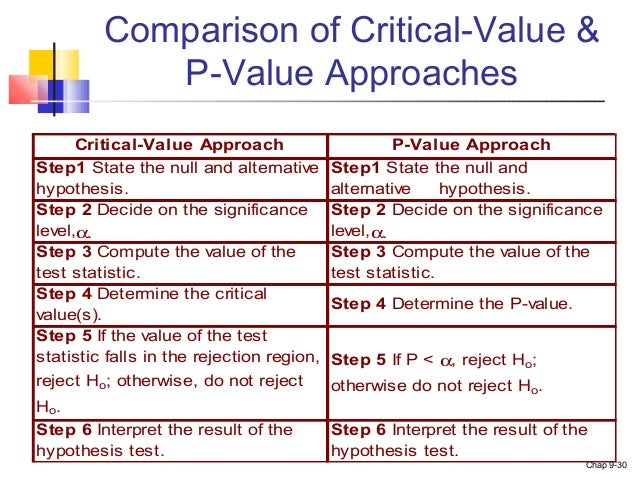
these are the two different approaches you're probably familar with; both are used to test for significance. I did not do AQA myself (i did Edexcel - new spec) and so the style of the q i found a bit different. Usually, it's pretty straightforward and they'll give u a set of data and ask you to find the PMCC using your calculator and then using sig. level (given), number of data (n) and your critical value tables etc. you can carry out the test. You'd need to compare the c.v w your PMCC (r value). I think bcos it's the new spec and there's more emphasis on problem-solving, they've made the questions more reasoning-based to test your understanding of the topic and not just put numbers into a calculator.
I can't guarantee this is a level, but it would help with understanding the estimated correlation coefficient.
The estimation (data fitting) process means that the estimated correlation coefficient isn't equal to the true (unknown) value. If you repeatedly did this estimation process with different data sets, the estimated would define a pdf (normal) centred on the true value. The true value would be the mean of the estimated and the std dev would give us an idea of how far it was from zero, as zero represents no correlation.
We only have one data set, so imagine the estimated value being the true one and then dividing it by the std dev, which is influenced by the number of data. This (z value) tells us how many std devs the estimated value is from zero. As with earlier in the thread, for a 95% confidence we'd like 0 to lie in either 2.5% tail so we can say the estimated correlation value is significant. This is what the p-value represents, as per a normal hypothesis test.
The mean of the distribution is the estimated correlation coefficient. The p-value is determined by both the mean and the std dev. As such, only the latter gives any form of reliability of the estimate.
Testing whether the estimated number 10 is significantly nonzero only makes sense if you have some idea about the uncertainty (width, standard deviation) of the estimation process. It's exactly the same here.
Original post by HS_1
these are the two different approaches you're probably familar with; both are used to test for significance. I did not do AQA myself (i did Edexcel - new spec) and so the style of the q i found a bit different. Usually, it's pretty straightforward and they'll give u a set of data and ask you to find the PMCC using your calculator and then using sig. level (given), number of data (n) and your critical value tables etc. you can carry out the test. You'd need to compare the c.v w your PMCC (r value). I think bcos it's the new spec and there's more emphasis on problem-solving, they've made the questions more reasoning-based to test your understanding of the topic and not just put numbers into a calculator.
these are the two different approaches you're probably familar with; both are used to test for significance. I did not do AQA myself (i did Edexcel - new spec) and so the style of the q i found a bit different. Usually, it's pretty straightforward and they'll give u a set of data and ask you to find the PMCC using your calculator and then using sig. level (given), number of data (n) and your critical value tables etc. you can carry out the test. You'd need to compare the c.v w your PMCC (r value). I think bcos it's the new spec and there's more emphasis on problem-solving, they've made the questions more reasoning-based to test your understanding of the topic and not just put numbers into a calculator.
Ahh, well these questions are from a Cambridge textbook which our teacher asked us to do - I've noticed overall, they make the questions much trickier than what we're used to. I have done those methods for the normal distribution, yes.
Original post by mqb2766
I can't guarantee this is a level, but it would help with understanding the estimated correlation coefficient.
The estimation (data fitting) process means that the estimated correlation coefficient isn't equal to the true (unknown) value. If you repeatedly did this estimation process with different data sets, the estimated would define a pdf (normal) centred on the true value. The true value would be the mean of the estimated and the std dev would give us an idea of how far it was from zero, as zero represents no correlation.
We only have one data set, so imagine the estimated value being the true one and then dividing it by the std dev, which is influenced by the number of data. This (z value) tells us how many std devs the estimated value is from zero. As with earlier in the thread, for a 95% confidence we'd like 0 to lie in either 2.5% tail so we can say the estimated correlation value is significant. This is what the p-value represents, as per a normal hypothesis test.
The mean of the distribution is the estimated correlation coefficient. The p-value is determined by both the mean and the std dev. As such, only the latter gives any form of reliability of the estimate.
Testing whether the estimated number 10 is significantly nonzero only makes sense if you have some idea about the uncertainty (width, standard deviation) of the estimation process. It's exactly the same here.
The estimation (data fitting) process means that the estimated correlation coefficient isn't equal to the true (unknown) value. If you repeatedly did this estimation process with different data sets, the estimated would define a pdf (normal) centred on the true value. The true value would be the mean of the estimated and the std dev would give us an idea of how far it was from zero, as zero represents no correlation.
We only have one data set, so imagine the estimated value being the true one and then dividing it by the std dev, which is influenced by the number of data. This (z value) tells us how many std devs the estimated value is from zero. As with earlier in the thread, for a 95% confidence we'd like 0 to lie in either 2.5% tail so we can say the estimated correlation value is significant. This is what the p-value represents, as per a normal hypothesis test.
The mean of the distribution is the estimated correlation coefficient. The p-value is determined by both the mean and the std dev. As such, only the latter gives any form of reliability of the estimate.
Testing whether the estimated number 10 is significantly nonzero only makes sense if you have some idea about the uncertainty (width, standard deviation) of the estimation process. It's exactly the same here.
Ahh right, that makes some sense. Thank you.
Original post by mqb2766
However, if the mean (correlation coefficient) moves further from 0, the whole distribution is shifted away from 0 so the p value decreases.
Just to confirm, so what you're saying here is that if the correlation coefficient increases, the p-value decreases?
Why would the p-value decrease? If there's a higher, more positive correlation between the variables - then wouldn't that make it more likely (higher p-value) for the event to occur?
Or, why does the p-value decrease? You said that the whole distribution is shifted away from zero, but why is that?
Do you have a reason (in more of an "A-level student's terms") as to why this is?
Original post by TheoP31
Just to confirm, so what you're saying here is that if the correlation coefficient increases, the p-value decreases?
Why would the p-value decrease? If there's a higher, more positive correlation between the variables - then wouldn't that make it more likely (higher p-value) for the event to occur?
Or, why does the p-value decrease? You said that the whole distribution is shifted away from zero, but why is that?
Do you have a reason (in more of an "A-level student's terms") as to why this is?
I'll draw a couple of pictuures tomorrow to try and explain. However, the simple picture is
* The correlation coefficient is the mean of the distribution
* The p-value is a "transformed" normalised distance (z = mean/stddev) from zero.
* The higher the mean (correlation coefficient) then the further the mean is from zero and the lower the p value (0 is more in the tail)
* The tighter the distribution (smaller stddev), which happens when you increase the number of data, the further it is from zero and the lower the p value (zero is more in the tail).
If the relationship is weak, you need more data to say it's statistically significant because the mean is closer to zero. It's harder to find a trend in a cloud of noise. The question says the inverse. If the data lies roughly on a line (high correlation coefficient), then there will be little chance it's happened randomly and the p value will be small.
(edited 3 years ago)
Original post by mqb2766
I'll draw a couple of pictuures tomorrow to try and explain. However, the simple picture is
* The correlation coefficient is the mean of the distribution
* The p-value is a "transformed" normalised distance (z = mean/stddev) from zero.
* The higher the mean (correlation coefficient) then the further the mean is from zero and the lower the p value (0 is more in the tail)
* The tighter the distribution (smaller stddev), which happens when you increase the number of data, the further it is from zero and the lower the p value (zero is more in the tail).
If the relationship is weak, you need more data to say it's statistically significant because the mean is closer to zero. It's harder to find a trend in a cloud of noise. The question says the inverse. If the data lies roughly on a line (high correlation coefficient), then there will be little chance it's happened randomly and the p value will be small.
Ohh right, thank you very much! That has helped!
Here is what I've written down for the answer, from using your information (and trying to make my response sound more of an A-Level student),
"If the correlation coefficient increases, then the p-value will decrease because the mean of the data is further from zero, since more of the data lies on the 'line' - the data is more positively correlated."
Would the above be a reasonable response to this question? (Since some of the stuff you've talked about above, I haven't learnt at all in class - and I have to send my answers to my Maths teacher next week sometime so I don't want my answers to look too suspicious lol).
Original post by mqb2766
Here are a couple of pictures. Ask about what you don't understand. There should be nothing "suspicious". You're doing a hypothesis test on the correlation estimate to see if it's significantly different from zero.


Ahh okay! Thank you very much. Very well presented and easy to follow!
 You’ve helped a lot.
Quick Reply
Related discussions
- PMCC
- hypothesis testing PMCC
- Hypothesis testing with critical values
- Hypothesis testing with critical values
- Wjec a level unit 4 maths
- Maths please help (Statistics Normal Distrubution)
- Binomial hypothesis test question
- normal distribution hypothesis testing
- a level maths hypothesis testing q
- Hypothesis Testing
- A level maths hypothesis tests
- Central Limit Theorem: How do you calculate the test statistic?
- OCR A Level Further Mathematics MEI Statistics Minor Y432/01-16 Jun 2023 [Exam Chat]
- Ocr Mei further maths stats major
- Applied Science Unit 3 investigation skills
- How should i revise statistics (A Level Maths)
- Hypothesis testing with critical values
- Alevel Maths question
- NEA T-test
- Studying AH statistics & prelim
Latest
Last reply 5 minutes ago
Official University College London Applicant Thread for 2024Last reply 6 minutes ago
Official UCL Offer Holders Thread for 2024 entryLast reply 7 minutes ago
Official Dental Hygiene and Therapy (Oral Health Science) 2024 Entry ThreadDentistry
2909
Last reply 9 minutes ago
Official: Aston University A100 2024 Entry Applicant threadMedical Schools
1149
Last reply 10 minutes ago
Pqip assesment centre role playLast reply 11 minutes ago
ATAS (Academic, Technology, Approval Scheme) Certificate 2023/2024Last reply 11 minutes ago
Official London School of Economics and Political Science 2024 Applicant ThreadLast reply 12 minutes ago
Official: Brighton and Sussex (BSMS) A100 2024 Entry ApplicantsLast reply 14 minutes ago
Weidenfeld Hoffmann Trust (WHT) Scholarship Notification (2024-2025)Last reply 20 minutes ago
National Probation ServiceLast reply 23 minutes ago
Home Office: Immigration Enforcement Casework Support AO 2024Last reply 24 minutes ago
Astrazeneca/pharmaceutical degree apprenticeships 2024Trending
Last reply 12 hours ago
Did Cambridge maths students find maths and further maths a level very easy?Last reply 2 weeks ago
Edexcel A Level Mathematics Paper 2 unofficial mark scheme correct me if wrongMaths
71
Trending
Last reply 12 hours ago
Did Cambridge maths students find maths and further maths a level very easy?Last reply 2 weeks ago
Edexcel A Level Mathematics Paper 2 unofficial mark scheme correct me if wrongMaths
71