This discussion is now closed.
Check out other Related discussions
- Edexcel A level Maths 2023 paper 3 UOMS
- How much math is in aqa a level psychology+sociology
- Help with s1 may 2013 (r)
- Edexcel GCSE Statistics Paper 1 Higher Tier (1ST0 1H) - 12th June 2023 [Exam Chat]
- Statistics Question
- Standard deviation larger than the mean.
- Academic literacy
- Edexcel GCSE Statistics Paper 2 Higher Tier (1ST0 2H) - 19th June 2023 [Exam Chat]
- employee within an education consulting institution.
- maths statistics- histograms
- edexcel gcse statistics
- s1!
- Geography NEA
- Can I get into Birmingham med school?
- Can I get into Birmingham Med school?
- Psychology
- Lse Economics and Economic history…help please
- Maths GCSE (edexcel higher paper 2 and 3 topics)
- Edexcel A Level Mathematics Paper 3 (9MA0 03) - 20th June 2023 [Exam Chat]
- OCR higher paper 4
Statistics 1 Histograms! (Estimate median)
Hey as the title says I was wondering how would I calculate the estimate median for a histogram?
Can I use the formula (n+1)/2 and then look at the frequency?
If I can but then what do i put as the median would i put for example 25-30 due to it being continuous data.
Thanks
Can I use the formula (n+1)/2 and then look at the frequency?
If I can but then what do i put as the median would i put for example 25-30 due to it being continuous data.
Thanks
Find the total number of samples (eg 60).
Then halve that number (30) and then look for the bar which contains teh 30th highest value.
For example:
0<x<5 - 10
5<x<10 - 15
10<x<15 - 22
15<x<20 - 13
the cumulative total from 0<x<10 is 25. But our value is the 30th value. This lies in 10<x<15, hence the answer is the interpolated value of this.
At x=10, y=25
At x=15, y=47
So we need to find the value of x when y=30.
This can be done by similar triangles, or by finding the equation of the line [y-y1] and substituting the value of y=30.
TheTallOne
Find the total number of samples (eg 60).
Then halve that number (30) and then look for the bar which contains teh 30th highest value.
For example:
0<x<5 - 10
5<x<10 - 15
10<x<15 - 22
15<x<20 - 13
the cumulative total from 0<x<10 is 25. But our value is the 30th value. This lies in 10<x<15, hence the answer is the interpolated value of this.
At x=10, y=25
At x=15, y=47
So we need to find the value of x when y=30.
This can be done by similar triangles, or by finding the equation of the line [y-y1] and substituting the value of y=30.
Then halve that number (30) and then look for the bar which contains teh 30th highest value.
For example:
0<x<5 - 10
5<x<10 - 15
10<x<15 - 22
15<x<20 - 13
the cumulative total from 0<x<10 is 25. But our value is the 30th value. This lies in 10<x<15, hence the answer is the interpolated value of this.
At x=10, y=25
At x=15, y=47
So we need to find the value of x when y=30.
This can be done by similar triangles, or by finding the equation of the line [y-y1] and substituting the value of y=30.
Sorry I don't get the part in bold I dont understand how you worked out y given that the original values are unknown. Could you explain please?
JBKProductions
Sorry I don't get the part in bold I dont understand how you worked out y given that the original values are unknown. Could you explain please?
Ok, assume we had the data above.
0<x<5 - 10
5<x<10 - 15
10<x<15 - 22
15<x<20 - 13
The total number of samples is 60. Thus the median value is at 30.
If you take the cumulative frequencies:
0<x<5 = 10
0<x<10 = 25
0<x<15=47
0<x<20 = 60
Since the median is 30, it must lie between 25 and 47.
Let x be the measured value (height, etc) and y be the cumulative frequency.
Look at this diagram of cumulative frequency.
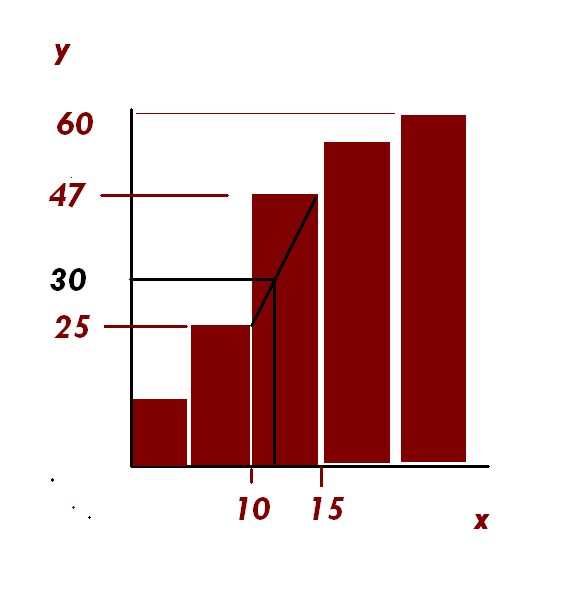
As you can see, at the value of x=10, the CF is 25. and at the value of x=15, CF is 47.
Between the value of 25 and 47 is the median, 30. You see the black line drawn from the value of 30 (going horizontal). This meets the diagonal line drawn from the lowest value (x=10 y=25) to the highest value (x=15 y=47). You are interpolating this part of the bar as if it is a straight line between x=10 and x=15.
So you can find an equation of this diagonal line.
And find m:
So,
Then sub in the value y=30 and find x. (Obviously x is somewhere between 10 and 15)
Spoiler
TheTallOne
Ok, assume we had the data above.
0<x<5 - 10
5<x<10 - 15
10<x<15 - 22
15<x<20 - 13
The total number of samples is 60. Thus the median value is at 30.
If you take the cumulative frequencies:
0<x<5 = 10
0<x<10 = 25
0<x<15=47
0<x<20 = 60
Since the median is 30, it must lie between 25 and 47.
Let x be the measured value (height, etc) and y be the cumulative frequency.
Look at this diagram of cumulative frequency.
As you can see, at the value of x=10, the CF is 25. and at the value of x=15, CF is 47.
Between the value of 25 and 47 is the median, 30. You see the black line drawn from the value of 30 (going horizontal). This meets the diagonal line drawn from the lowest value (x=10 y=25) to the highest value (x=15 y=47). You are interpolating this part of the bar as if it is a straight line between x=10 and x=15.
So you can find an equation of this diagonal line.
And find m:
So,
Then sub in the value y=30 and find x. (Obviously x is somewhere between 10 and 15)
Spoiler
oh ok thanks
JBKProductions
oh ok thanks
No problem.
Related discussions
- Edexcel A level Maths 2023 paper 3 UOMS
- How much math is in aqa a level psychology+sociology
- Help with s1 may 2013 (r)
- Edexcel GCSE Statistics Paper 1 Higher Tier (1ST0 1H) - 12th June 2023 [Exam Chat]
- Statistics Question
- Standard deviation larger than the mean.
- Academic literacy
- Edexcel GCSE Statistics Paper 2 Higher Tier (1ST0 2H) - 19th June 2023 [Exam Chat]
- employee within an education consulting institution.
- maths statistics- histograms
- edexcel gcse statistics
- s1!
- Geography NEA
- Can I get into Birmingham med school?
- Can I get into Birmingham Med school?
- Psychology
- Lse Economics and Economic history…help please
- Maths GCSE (edexcel higher paper 2 and 3 topics)
- Edexcel A Level Mathematics Paper 3 (9MA0 03) - 20th June 2023 [Exam Chat]
- OCR higher paper 4
Latest
Trending
Last reply 6 days ago
Did Cambridge maths students find maths and further maths a level very easy?Last reply 3 weeks ago
Edexcel A Level Mathematics Paper 2 unofficial mark scheme correct me if wrongMaths
71
Trending
Last reply 6 days ago
Did Cambridge maths students find maths and further maths a level very easy?Last reply 3 weeks ago
Edexcel A Level Mathematics Paper 2 unofficial mark scheme correct me if wrongMaths
71


