Hysteresis
Hi.
Basically, as part of a final-year river management module, I need to work out the hysteresis formed by two separate datasets;
1. The discharge measured within a river over a 10-hour period;
2. The suspended sediment concentration within the same river, measured over the same 10 hours.
I have 2 graphs from the data.
The discharge data forms a positively skewed trend, not dissimilar to this:
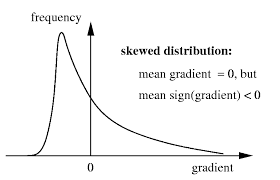
The suspended sediment concentration data forms a trend with a lesser positive skew, not dissimilar to this:

I need to work out the hysteresis. I am not sure how I should go about working this out - do I need to create a hysteresis loop? If so, how should I go about doing this?
Any sensible advice is much appreciated.
Thanks in advance.
Basically, as part of a final-year river management module, I need to work out the hysteresis formed by two separate datasets;
1. The discharge measured within a river over a 10-hour period;
2. The suspended sediment concentration within the same river, measured over the same 10 hours.
I have 2 graphs from the data.
The discharge data forms a positively skewed trend, not dissimilar to this:
The suspended sediment concentration data forms a trend with a lesser positive skew, not dissimilar to this:
I need to work out the hysteresis. I am not sure how I should go about working this out - do I need to create a hysteresis loop? If so, how should I go about doing this?
Any sensible advice is much appreciated.
Thanks in advance.
(edited 13 years ago)
Quick Reply
Latest
Trending
Last reply 4 days ago
Did Cambridge maths students find maths and further maths a level very easy?Last reply 2 weeks ago
Edexcel A Level Mathematics Paper 2 unofficial mark scheme correct me if wrongMaths
71
Trending
Last reply 4 days ago
Did Cambridge maths students find maths and further maths a level very easy?Last reply 2 weeks ago
Edexcel A Level Mathematics Paper 2 unofficial mark scheme correct me if wrongMaths
71


