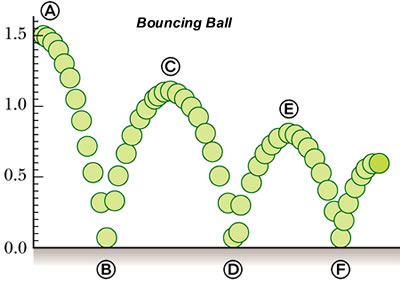
Displacement is less each time the ball bounces as its initial energy is lost to its surroundings i.e. heat energy due to friction with the ground.
Some other graphs may show the ball bouncing back up to its original height in a "perfect world" where no energy is lost to its surroundings and the energy in the ball is conserved throughout each bounce.
Original post by Vulpes
Displacement is less each time the ball bounces as its initial energy is lost to its surroundings i.e. heat energy due to friction with the ground.
Some other graphs may show the ball bouncing back up to its original height in a "perfect world" where no energy is lost to its surroundings and the energy in the ball is conserved throughout each bounce.
Surely the displacement should start at zero?
Original post by Beth_L_G
Surely the displacement should start at zero?
Displacement between the ball and the ground. Not from the starting point of the motion.
Original post by Vulpes
Displacement between the ball and the ground. Not from the starting point of the motion.
i should have specified in the question
sorry

I'm looking to see what it looks like if you take your starting point as zero displacement
Original post by Beth_L_G
i should have specified in the question
sorry
I'm looking to see what it looks like if you take your starting point as zero displacement
sorry
I'm looking to see what it looks like if you take your starting point as zero displacement
weird question but it'll look like:
gimme a sec... weird output./
 /
/GOT ITTT ^
(edited 13 years ago)
It would look exactly the same as in the graph posted but with the horizontal axis moved up to the starting point at A.
The vertical axis is then labelled downwards as zero, -0.5, -1.0, -1.5m
This takes the starting point to be at zero displacement, and the downwards direction as negative.
The vertical axis is then labelled downwards as zero, -0.5, -1.0, -1.5m
This takes the starting point to be at zero displacement, and the downwards direction as negative.
Original post by Stonebridge
It would look exactly the same as in the graph posted but with the horizontal axis moved up to the starting point at A.
The vertical axis is then labelled downwards as zero, -0.5, -1.0, -1.5m
This takes the starting point to be at zero displacement, and the downwards direction as negative.
The vertical axis is then labelled downwards as zero, -0.5, -1.0, -1.5m
This takes the starting point to be at zero displacement, and the downwards direction as negative.
Thanks
i got in a huge argument with my teacher because i told him that and tried to explain to him why and he just couldn't understand
just asked on here to make sure i was right and wasn't just embarassing myself :L
Thank you for your help!
Quick Reply
Related discussions
- Help maths
- Help mechanics
- is this correct relationship between velcoty, acceleration and displacement?
- Kinematics help a level
- Physics question displacement
- Edexcel M1 ex2D Question 11b
- Help mechanicsss
- A level mechanics
- Need help with A Level Simple Harmonic Motion question
- Physics AS June 2021 Q3.3
- AQA AS Physics - June 2022 - Paper 2 Question 4.4 - struggling
- The Weighing Machine - Isaac physics
- Differentiation
- A-Level Using areas to find distances and displacements
- Can anyone help with this SUVAT A-level question?
- as level mechanics suvat
- Mechanics Question Help
- Physics question help please?
- AS Applied Unit 9 Kinematics 2 (variable acceleration)
- A level physics