Phase diagram issues
Hiya, so this may end up being a bit of data overload but I'm in the midst of writing a lab report and can't seem to get this phase graph right and I can't seem to find the issue?
Basically these are the recorded experimental results which is just the boiling points and refractive index of the acetone-chloroform mixture and the graph plotted to try and calculate the molar fraction
This led me to calculate the molar fraction values to be as follows
But considering that the more vapour there is in the mixture, the less liquid there should be? That's what confused me and the values are pretty similar for both
I also had to draw the phase diagram for this mixture based off these values, at first I got 2 very similar lines, and only got this after reversing the order of the XA liquid values which still isn't right.
I know this is a long shot as it is quite specific, but if anyone has any ideas I'd be super grateful
Basically these are the recorded experimental results which is just the boiling points and refractive index of the acetone-chloroform mixture and the graph plotted to try and calculate the molar fraction
Spoiler
This led me to calculate the molar fraction values to be as follows
Spoiler
But considering that the more vapour there is in the mixture, the less liquid there should be? That's what confused me and the values are pretty similar for both
I also had to draw the phase diagram for this mixture based off these values, at first I got 2 very similar lines, and only got this after reversing the order of the XA liquid values which still isn't right.
Spoiler
I know this is a long shot as it is quite specific, but if anyone has any ideas I'd be super grateful
Original post by KaylaB
x
So why did you reverse one of the final graphs? I'm not 100% sure, but I'd think they should be similar shape but with the vapour line slightly above the liquid phase line
Original post by langlitz
So why did you reverse one of the final graphs? I'm not 100% sure, but I'd think they should be similar shape but with the vapour line slightly above the liquid phase line
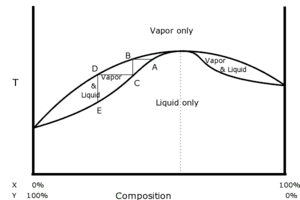
As it's supposed to look similar to this, and reversing was the only thing was gave me which remotely resembles that

Original post by KaylaB
As it's supposed to look similar to this, and reversing was the only thing was gave me which remotely resembles that
Yeah sure, but it doesn't necessarily need to have a high boiling azeotrope like in that diagram
Edit: and I can't really think of a way for justifying reversing the values

(edited 7 years ago)
Original post by langlitz
Yeah sure, but it doesn't necessarily need to have a high boiling azeotrope like in that diagram
Edit: and I can't really think of a way for justifying reversing the values
Edit: and I can't really think of a way for justifying reversing the values
Yeah I suppose, and the data could also be to blame, considering it was a collaborative effort. We had 6 pairs of people doing 2 each, so different sets of apparatus and all that.

Quick Reply
Related discussions
- Physics question ripples
- A level Physics
- HNC, MATHS, draw a vector diagram
- Mechanics A Level Maths Problem
- RLC circuit
- A1/A2 Mechanics - Pulleys MadasMaths Question
- Calvin Cycle
- HNC electrical engineering
- economics edexcel a level
- interference
- a level biology mitosis question
- Forces a levels
- RAF Halton pay/ deductions
- TSR Goes Green: Can studying be made more sustainable?
- Conditional probability
- Maths A-Level Vectors
- How would an induced emf graph look like if magnetic flux varies in a sine curve?
- A Level Physics - Electric Fields Question
- scrapping btecs! Am I cooked?
- alevel subject combo
Latest
Trending
Last reply 1 week ago
Im confused about this chemistry question, why does it form these productsTrending
Last reply 1 week ago
Im confused about this chemistry question, why does it form these products


