Titration Graph
Why is it that the titration graphs show:
I) slight changes
II) giant immediate change in ph
III) slight change again
rather than just a gradual change from alkaline to acidic?
And also why is it the end point is different, surely the end point of an acid/base titration should always be ph 7
I) slight changes
II) giant immediate change in ph
III) slight change again
rather than just a gradual change from alkaline to acidic?
And also why is it the end point is different, surely the end point of an acid/base titration should always be ph 7
That literally doesn't help even a little
Posted from TSR Mobile
Posted from TSR Mobile
The end-point of the titration occurs at pH7 when you have a strong acid + strong base or a weak acid + weak base. The end point of a strong acid + weak base titration will be less than pH7. This is because the final product is slightly acidic.
For example, HCl + NH4OH -> H2O + NH4Cl
Although, there are no hydrogen and hydroxide ions left from the acid or base, the Cl- ions from NH4Cl can go to the H+ ions in the water equilibrium, and the NH4 ions can go to the OH- ions. However, since NH4OH is a weak base, there will be some molecular NH4OH so [H+] > [OH-].
A similar thing happens when you have a weak acid + strong base but the end point will be greater than pH 7.
For the shape of the graph, you have to remember that the endpoint is based on concentration but the axis is pH which is the log of concentration.
The steep portion of the graph near the endpoint occurs because you are increasing the concentration of hydroxide by adding alkali and decreasing the concentration of hydrogen ions by using them up. Whereas, at the start, you are mainly decreasing hydrogen ion concentration by reacting the 'excess' hydrogen ions with some alkali and at the end you are mainly increasing hydroxide ion concentration by adding the 'excess' hydroxide ions with some hydrogen ions.
(edited 11 years ago)
Original post by Asklepios
The end-point of the titration occurs at pH7 when you have a strong acid + strong base or a weak acid + weak base. The end point of a strong acid + weak base titration will be less than pH7. This is because the final product is slightly acidic.
For example, HCl + NH4OH -> H2O + NH4Cl
Although, there are no hydrogen and hydroxide ions left from the acid or base, the Cl- ions from NH4Cl can go to the H+ ions in the water equilibrium, and the NH4 ions can go to the OH- ions. However, since NH4OH is a weak base, there will be some molecular NH4OH so [H+] > [OH-].
A similar thing happens when you have a weak acid + strong base but the end point will be greater than pH 7.
For the shape of the graph, you have to remember that the endpoint is based on concentration but the axis is pH which is the log of concentration.
The steep portion of the graph near the endpoint occurs because you are increasing the concentration of hydroxide by adding alkali and decreasing the concentration of hydrogen ions by using them up. Whereas, at the start, you are mainly decreasing hydrogen ion concentration by reacting the 'excess' hydrogen ions with some alkali and at the end you are mainly increasing hydroxide ion concentration by adding the 'excess' hydroxide ions with some hydrogen ions.
For example, HCl + NH4OH -> H2O + NH4Cl
Although, there are no hydrogen and hydroxide ions left from the acid or base, the Cl- ions from NH4Cl can go to the H+ ions in the water equilibrium, and the NH4 ions can go to the OH- ions. However, since NH4OH is a weak base, there will be some molecular NH4OH so [H+] > [OH-].
A similar thing happens when you have a weak acid + strong base but the end point will be greater than pH 7.
For the shape of the graph, you have to remember that the endpoint is based on concentration but the axis is pH which is the log of concentration.
The steep portion of the graph near the endpoint occurs because you are increasing the concentration of hydroxide by adding alkali and decreasing the concentration of hydrogen ions by using them up. Whereas, at the start, you are mainly decreasing hydrogen ion concentration by reacting the 'excess' hydrogen ions with some alkali and at the end you are mainly increasing hydroxide ion concentration by adding the 'excess' hydroxide ions with some hydrogen ions.
ooooo thats a lot of help but following on from that
1) So your saying that after the reaction, there's still a combination of products "in solution" as it were, that cause either a slightly higher or lower than neutral ph. But for weak/weak and strong/strong the effects cancel each other out hence it is at 7?
and for part 2, i dont really understand, sorry, i know its frustrating, but it just seems odd to me
I think the graph your looking at isnt the same as mine?
(edited 11 years ago)
Original post by kinglynx
ooooo thats a lot of help but following on from that
1) So your saying that after the reaction, there's still a combination of products "in solution" as it were, that cause either a slightly higher or lower than neutral ph. But for weak/weak and strong/strong the effects cancel each other out hence it is at 7?
and for part 2, i dont really understand, sorry, i know its frustrating, but it just seems odd to me
I think the graph your looking at isnt the same as mine?
Yeah, thats right, for an acid and base of the same strength, the effects cancel each other out.
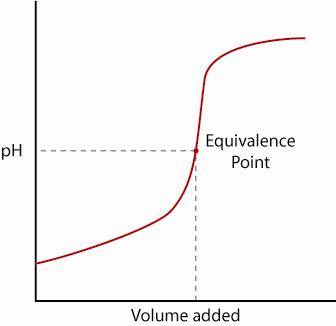
I'm looking at this sort of graph, and i'm describing the addition of alkali to acid.
It isn't a straight line because pH is logarithmic. The almost vertical section occurs because the pH rapidly changes near the endpoint. At the endpoint [OH-]=[H+]. If you add even a little bit of H+ or OH- then there will be a significant change in pH, but at the LHS and RHS there isn't such a great increase because the OH-/H+ is effectively in excess.
(edited 11 years ago)
Original post by Asklepios
Yeah, thats right, for an acid and base of the same strength, the effects cancel each other out.
I'm looking at this sort of graph, and i'm describing the addition of alkali to acid.
It isn't a straight line because pH is logarithmic. The almost vertical section occurs because the pH rapidly changes near the endpoint. At the endpoint [OH-]=[H+]. If you add even a little bit of H+ or OH- then there will be a significant change in pH, but at the LHS and RHS there isn't such a great increase because the OH-/H+ is effectively in excess.
Oh okay, we do acid vs PH, so its effectively just a flipped mirror image.
Im sort of coming round to the idea but why is it that the ions are effectively in excess near the start and end but have so much "strength" towards the middle?
Original post by kinglynx
Oh okay, we do acid vs PH, so its effectively just a flipped mirror image.
Im sort of coming round to the idea but why is it that the ions are effectively in excess near the start and end but have so much "strength" towards the middle?
Im sort of coming round to the idea but why is it that the ions are effectively in excess near the start and end but have so much "strength" towards the middle?
Imagine you are adding acid to an alkali. At the start, you are adding 1 drop of acid to a beaker of alkali - the alkali is in excess, so the change in pH is small. Near the endpoint, the beaker is mainly water, and a little bit of alkali, so there is a greater change in pH.
Original post by Asklepios
Imagine you are adding acid to an alkali. At the start, you are adding 1 drop of acid to a beaker of alkali - the alkali is in excess, so the change in pH is small. Near the endpoint, the beaker is mainly water, and a little bit of alkali, so there is a greater change in pH.
I get what your saying but it's not convincing , for instance
Picture this
You have 10 molecules of acid, you add 1 molecule of alkali and your left with 9 acid and 1 water
8-2
7-3
6-4
5-5
4-6
3-7
2-8
1-9
0-10
As you can see, the decrease is linear. :/
I'm probably missing something
Posted from TSR Mobile
Original post by kinglynx
I get what your saying but it's not convincing , for instance
Picture this
You have 10 molecules of acid, you add 1 molecule of alkali and your left with 9 acid and 1 water
8-2
7-3
6-4
5-5
4-6
3-7
2-8
1-9
0-10
As you can see, the decrease is linear. :/
I'm probably missing something
Posted from TSR Mobile
Picture this
You have 10 molecules of acid, you add 1 molecule of alkali and your left with 9 acid and 1 water
8-2
7-3
6-4
5-5
4-6
3-7
2-8
1-9
0-10
As you can see, the decrease is linear. :/
I'm probably missing something
Posted from TSR Mobile
You are right, the concentration of H+ ions decreases linearly, but the pH = -log[H+], so has a different shape of graph.
Original post by Asklepios
You are right, the concentration of H+ ions decreases linearly, but the pH = -log[H+], so has a different shape of graph.
OOOOOOOOOOOO thanks mate! that makes sense
finally got it in the end :P
Quick Reply
Related discussions
- Btec applied science unit 2
- Wjec alevel chemistry analysis
- BTEC applied science unit 19
- OCR Chemistry Paper 1 GCSE 2022 (triple higher)
- A level chemistry
- Etha
- gcse chemistry help
- Titration questions
- Titration paper
- hard titration alevel chem Q!
- A level Chemistry Titration
- Chemistry Calculation Question
- How hard is the Btec level 3 extended certificate in applied science?
- As level / a level chemistry concentration help!!
- Iodometric Titration to determine caffeine content
- Kc Titration Question
- a level chemistry
- Titration and Moles question
- Indicator colour question.
- can u use another exam board textbook
Latest
Trending
Last reply 1 week ago
Im confused about this chemistry question, why does it form these productsTrending
Last reply 1 week ago
Im confused about this chemistry question, why does it form these products